- 120 Actual Exam Questions
- Compatible with all Devices
- Printable Format
- No Download Limits
- 90 Days Free Updates
Get All Tableau Certified Data Analyst Exam Questions with Validated Answers
| Vendor: | Tableau |
|---|---|
| Exam Code: | TDA-C01 |
| Exam Name: | Tableau Certified Data Analyst |
| Exam Questions: | 120 |
| Last Updated: | December 13, 2025 |
| Related Certifications: | |
| Exam Tags: | Intermediate Level Tableau Data Analyst and Business Analysts |
Looking for a hassle-free way to pass the Tableau Certified Data Analyst exam? DumpsProvider provides the most reliable Dumps Questions and Answers, designed by Tableau certified experts to help you succeed in record time. Available in both PDF and Online Practice Test formats, our study materials cover every major exam topic, making it possible for you to pass potentially within just one day!
DumpsProvider is a leading provider of high-quality exam dumps, trusted by professionals worldwide. Our Tableau TDA-C01 exam questions give you the knowledge and confidence needed to succeed on the first attempt.
Train with our Tableau TDA-C01 exam practice tests, which simulate the actual exam environment. This real-test experience helps you get familiar with the format and timing of the exam, ensuring you're 100% prepared for exam day.
Your success is our commitment! That's why DumpsProvider offers a 100% money-back guarantee. If you don’t pass the Tableau TDA-C01 exam, we’ll refund your payment within 24 hours no questions asked.
Don’t waste time with unreliable exam prep resources. Get started with DumpsProvider’s Tableau TDA-C01 exam dumps today and achieve your certification effortlessly!
Open the link to Book1 found on the desktop. Open the CategoryPercentage worksheet.
Modify the bar chart show the percentage of sales for each Subcategory within every Category. The total percentage for every Category must be 100%.

To modify the bar chart to show the percentage of sales for each Subcategory within every Category, you need to do the following steps:
Open the link to Book1 found on the desktop. This will open the Tableau workbook that contains the CategoryPercentage worksheet.
Click on the CategoryPercentage tab at the bottom of the workbook to open the worksheet. You will see a bar chart that shows the total sales for each Subcategory across all Categories.
Right-click on Sales on the Columns shelf and select Add Table Calculation from the menu. This will open a dialog box that allows you to apply a calculation to your measure.
Select Percent of Total from the Calculation Type drop-down list. This will calculate the percentage of sales for each Subcategory out of the total sales for all Subcategories.
Select Category from the Compute Using drop-down list. This will calculate the percentage of sales for each Subcategory within every Category, instead of across all Categories. The total percentage for every Category will be 100%.
Click OK to apply the table calculation. You will see that the bar chart now shows the percentage of sales for each Subcategory within every Category.
You have the following dataset.

Which formula calculates the percent difference in sales relative to the same quarter the previous year as shown in the Calculation field?
The formula in option B calculates the percent difference in sales relative to the same quarter the previous year. It subtracts the sales of the same quarter from the previous year from the current year's sales, and then divides this by the previous year's sales. This gives a percentage change, which aligns with what is shown in the Calculation field of your dataset. The LOOKUP function returns the value of a specified offset from the current row in the partition. In this case, the offset is -4, which means the value of the same measure four rows above the current row. This corresponds to the same quarter of the previous year, assuming the data is sorted by quarter.Reference:
Tableau Certified Data Analyst Study Guide
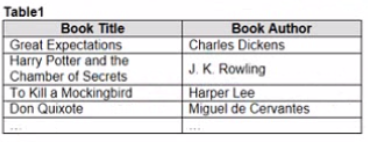
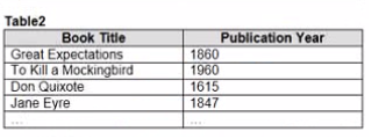
You have the Mowing two tables that contains data about the books in a library.


Both tables are incomplete so there are books missing from the tables.
You need to combine the tables. The solution must ensure that all the data is retained
Which type of join should you use?
To combine the two tables that contain data about books in a library and ensure that all the data is retained, you should use a full outer join. A full outer join is a type of join that returns all rows from both tables, regardless of whether there is a match or not. If there is no match, null values are filled in for the missing fields.
To perform a full outer join, you need to do the following steps:
Connect to both tables as your data sources in Tableau. You can use either live or extract connections.
Drag one table to the canvas and drop it on top of another table. This will create a join between them based on a common field.
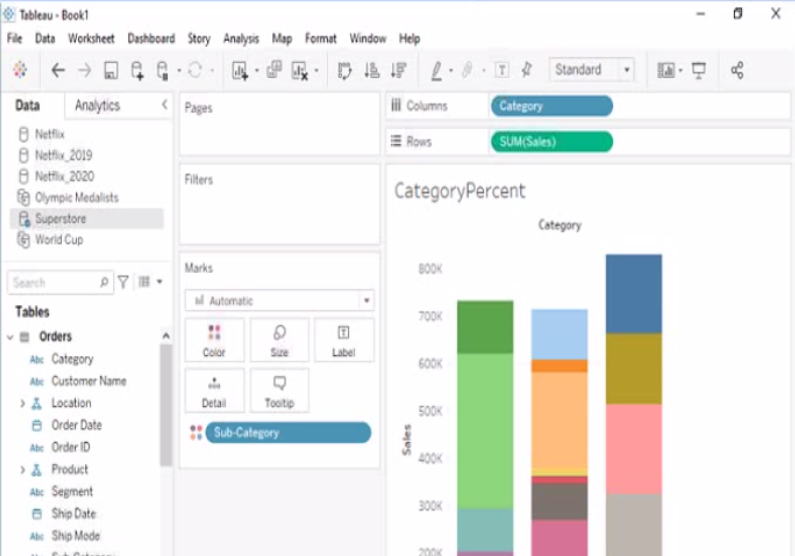
Click on the join icon between the tables and select Full Outer Join from the drop-down list. This will change the join type to full outer join and show all rows from both tables.
Optionally, you can add or remove join clauses by clicking on Add or Remove buttons next to each clause. You can also change or rename fields by clicking on them.
The other types of joins are not correct for this scenario. An inner join returns only the rows that have a match in both tables, which will exclude any books that are missing from either table. A left join returns all rows from the left table and only the matching rows from the right table, which will exclude any books that are only in the right table. A right join returns all rows from the right table and only the matching rows from the left table, which will exclude any books that are only in the left table. Reference: https://help.tableau.com/current/pro/desktop/en-us/joining_tables.htm https://help.tableau.com/current/pro/desktop/en-us/join_types.htm
You have the following line chart that shows the average sales by month.

Which month had the biggest increase in swage sales compared to me previous month in 2019?
You want to show the cumulative total of each year for every state.
Which quick table calculation should you use?
Security & Privacy
Satisfied Customers
Committed Service
Money Back Guranteed