- 464 Actual Exam Questions
- Compatible with all Devices
- Printable Format
- No Download Limits
- 90 Days Free Updates
Get All Microsoft Power BI Data Analyst Exam Questions with Validated Answers
| Vendor: | Microsoft |
|---|---|
| Exam Code: | PL-300 |
| Exam Name: | Microsoft Power BI Data Analyst |
| Exam Questions: | 464 |
| Last Updated: | August 8, 2026 |
| Related Certifications: | Power BI Data Analyst Associate |
| Exam Tags: | Microsoft Data Analyst certifications, Data and AI certifications Associate Level Microsoft Power BI Data Analyst and BI Professionals |
Looking for a hassle-free way to pass the Microsoft Power BI Data Analyst exam? DumpsProvider provides the most reliable Dumps Questions and Answers, designed by Microsoft certified experts to help you succeed in record time. Available in both PDF and Online Practice Test formats, our study materials cover every major exam topic, making it possible for you to pass potentially within just one day!
DumpsProvider is a leading provider of high-quality exam dumps, trusted by professionals worldwide. Our Microsoft PL-300 exam questions give you the knowledge and confidence needed to succeed on the first attempt.
Train with our Microsoft PL-300 exam practice tests, which simulate the actual exam environment. This real-test experience helps you get familiar with the format and timing of the exam, ensuring you're 100% prepared for exam day.
Your success is our commitment! That's why DumpsProvider offers a 100% money-back guarantee. If you don’t pass the Microsoft PL-300 exam, we’ll refund your payment within 24 hours no questions asked.
Don’t waste time with unreliable exam prep resources. Get started with DumpsProvider’s Microsoft PL-300 exam dumps today and achieve your certification effortlessly!
You have a Microsoft SharePoint Online site that contains several document libraries.
One of the document libraries contains manufactunng reports saved as Microsoft Excel files. All the manufacturing reports have the same data structure.
You need to use Power Bl Desktop to load only the manufacturing reports to a table for analysis.
What should you do?
You are creating a query to be used as a Country dimension in a star schema.
A snapshot of the source data is shown in the following table.

You need to create the dimension. The dimension must contain a list of unique countries.
Which two actions should you perform? Each correct answer presents part of the solution.
Delete the City column. You don't need this column for your Country dimension, as it is not a descriptive attribute of Country. You can create another dimension table for City if you want to use it in your analysis.
Remove duplicates from the Country column. You want to have a list of unique countries in your dimension table, so you need to remove any duplicate values from this column.
Note: This question is part of a series of questions that present the same scenario. Each question in the series contains a unique solution that might meet the stated goals. Some question sets might have more than one correct solution, while others might not have a correct solution.
After you answer a question in this section, you will NOT be able to return to it. As a result, these questions will not appear in the review screen.
You are modeling data by using Microsoft Power Bl. Part of the data model is a large Microsoft SQL Server table named Order that has more than 100 million records.
During the development process, you need to import a sample of the data from the Order table.
Solution: You write a DAX expression that uses the FILTER function.
Does this meet the goal?
The filter is applied after the data is imported.
Instead add a WHERE clause to the SQL statement.
https://docs.microsoft.com/en-us/power-bi/connect-data/service-gateway-sql-tutorial
You are reviewing a query that produces 10,000 rows in the Power Query Editor.
You need to identify whether a column contains only unique values.
Which two Data Preview options can you use? Each correct answer presents a complete solution.
NOTE: Each correct selection is worth one point.
B: Column distribution: This feature provides a set of visuals underneath the names of the columns that showcase the frequency and distribution of the values in each of the columns. The data in these visualizations is sorted in descending order from the value with the highest frequency.
By hovering over the distribution data in any of the columns, you get information about the overall data in the column (with distinct count and unique values).
A: Column profile: This feature provides a more in-depth look at the data in a column [compared to column distribution]. Apart from the column distribution chart, it contains a column statistics chart.
https://docs.microsoft.com/en-us/power-query/data-profiling-tools
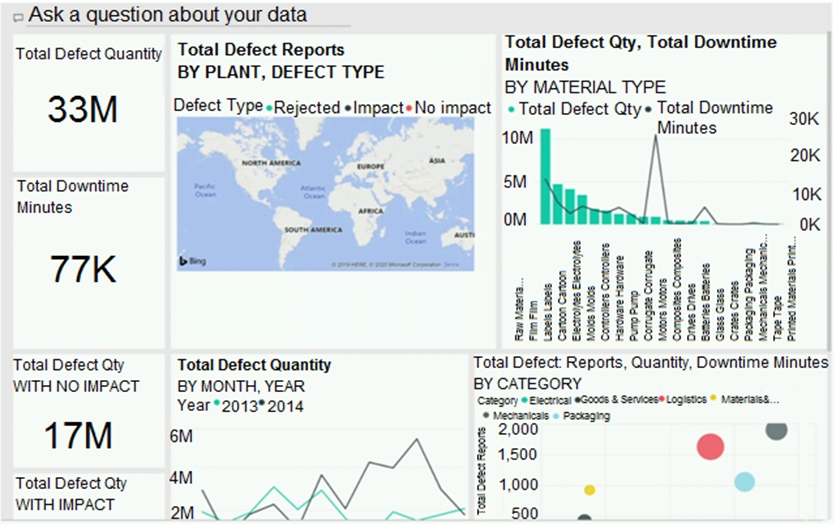
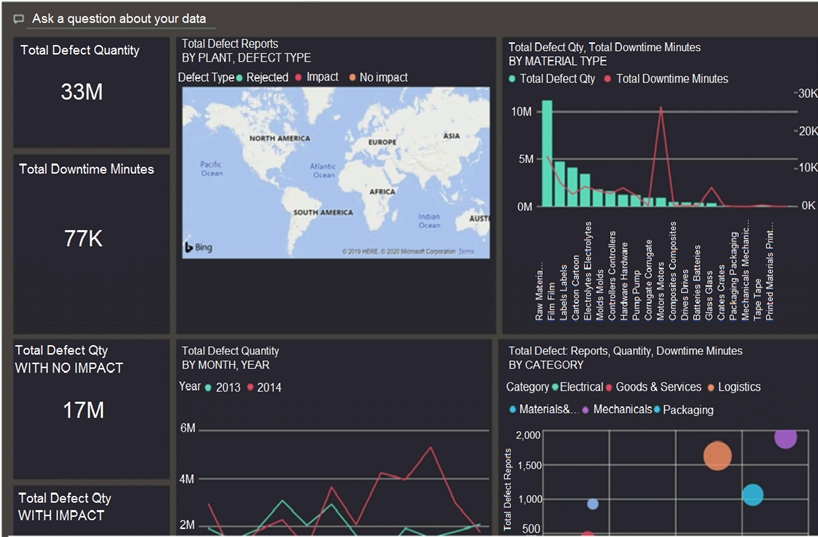
You maintain a Power Bl workspace that contains a supplier quality dashboard. The dashboard contains 10 card visuals, two map visuals and five bar chart visuals.
The dashboard mobile layout is shown in the exhibit. (Click the Exhibit tab.)

You need to modify the dashboard mobile layout to meet the following requirements:
* Only show single-value visuals.
* Minimize scrolling.
What should you do?
Security & Privacy
Satisfied Customers
Committed Service
Money Back Guranteed