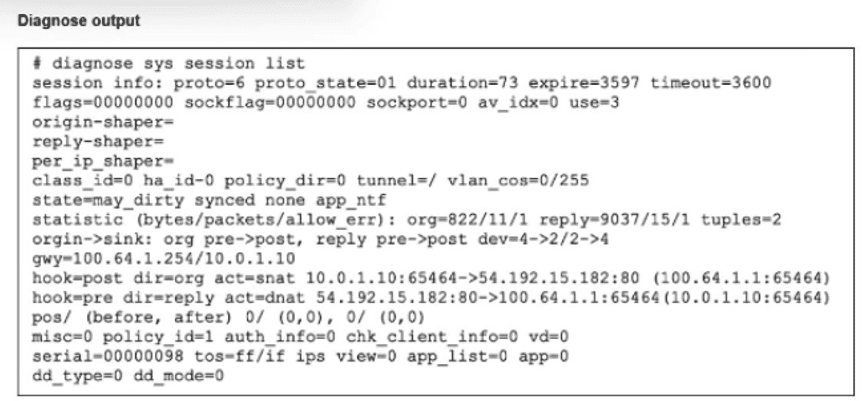
- 99 Actual Exam Questions
- Compatible with all Devices
- Printable Format
- No Download Limits
- 90 Days Free Updates
Get All FCSS - Network Security 7.6 Support Engineer Exam Questions with Validated Answers
| Vendor: | Fortinet |
|---|---|
| Exam Code: | FCSS_NST_SE-7.6 |
| Exam Name: | FCSS - Network Security 7.6 Support Engineer |
| Exam Questions: | 99 |
| Last Updated: | January 9, 2026 |
| Related Certifications: | Fortinet Certified Solution Specialist, FCSS Fortinet Certified Solution Specialist Network Security |
| Exam Tags: | Professional Fortinet Network Security Engineers and Administrators |
Looking for a hassle-free way to pass the Fortinet FCSS - Network Security 7.6 Support Engineer exam? DumpsProvider provides the most reliable Dumps Questions and Answers, designed by Fortinet certified experts to help you succeed in record time. Available in both PDF and Online Practice Test formats, our study materials cover every major exam topic, making it possible for you to pass potentially within just one day!
DumpsProvider is a leading provider of high-quality exam dumps, trusted by professionals worldwide. Our Fortinet FCSS_NST_SE-7.6 exam questions give you the knowledge and confidence needed to succeed on the first attempt.
Train with our Fortinet FCSS_NST_SE-7.6 exam practice tests, which simulate the actual exam environment. This real-test experience helps you get familiar with the format and timing of the exam, ensuring you're 100% prepared for exam day.
Your success is our commitment! That's why DumpsProvider offers a 100% money-back guarantee. If you don’t pass the Fortinet FCSS_NST_SE-7.6 exam, we’ll refund your payment within 24 hours no questions asked.
Don’t waste time with unreliable exam prep resources. Get started with DumpsProvider’s Fortinet FCSS_NST_SE-7.6 exam dumps today and achieve your certification effortlessly!
Exhibit.

Refer to the exhibit, which contains a screenshot of some phase 1 settings.
The VPN is not up. To diagnose the issue, the administrator enters the following CLI commands on an SSH session on FortiGate:

However, the IKE real-time debug does not show any output. Why?
To display debug output on FortiGate devices, you must always run both the application-specific debug command and the global debug enable command. The commanddiagnose debug application ike -1sets up the detail level for the IKE daemon debug, but it doesnot display any debug output on its own. As described in the FortiOS CLI debugging manuals, the commanddiagnose debug enableactivates debug output on the console, making all previously set debugs visible. This is especially important for VPN troubleshooting---without the enable command, no output appears even if there is VPN traffic.
The correct diagnostic sequence is:
diagnose debug application ike -1
diagnose debug enable
This procedure is found in every FortiOS CLI debug tutorial and troubleshooting workflow.
FortiOS CLI Reference: Debugging VPNs and Real-time Debug Output
FortiGate VPN Troubleshooting Guide: Required Steps for Debug Output
Refer to the exhibit, which shows a partial output from the get router info routing-table database command.

The administrator wants to configure a default static route for port3 and assign a distance of 50 and a priority of 0.
What will happen to the port1 and port2 default static routes after the port3 default static route is created?
Refer to the exhibit showing a debug output.

An administrator deployed FSSO in DC Agent Mode but FSSO is failing on FortiGate. Pinging FortiGate from where the collector agent is deployed is successful.
The administrator then produces the debug output shown in the exhibit.
What could be causing this error message?
Refer to the exhibit.

The administrator did not override the FortiGuard FODN or IP address in the FortiGate configuration
Which IP address did FortiGate get when resolving the servicem,fortiguard.net name?
Based on the Fortinet FCSS - Network Security 7.6 documents and the analysis of the provided exhibits, here are the verified answers.
Questio ns no: 93
Verified Answer: B
Comprehensive and Detailed Explanation with all FCSS - Network Security 7.6 documents:
To determine which IP address was resolved via DNS, we must interpret the Flags column in the diagnose debug rating output provided in the exhibit:
Analyze the Flags:
Flag I (Initial): This flag indicates the IP address that was returned by the DNS query when resolving the FortiGuard FQDN (e.g., service.fortiguard.net). It acts as the 'seed' or initial contact point.
Flag D (Discovered): This flag indicates servers that were not resolved via DNS but were learned dynamically from the FortiGuard network during protocol exchanges (server lists sent by the initial server).
Flag F (Failed): Indicates a server that the FortiGate tried to contact but failed.
Examine the Exhibit:
The IP address 209.22.147.36 has the flag I next to it.
The IP 208.91.112.194 has the flag D.
The IP 121.111.236.179 has the flag F.
Conclusion:
Since the question asks specifically for the IP obtained when resolving the name, we look for the 'Initial' (I) flag. Therefore, 209.22.147.36 is the correct answer.
Comprehensive and Detailed Explanation with all FCSS - Network Security 7.6 documents:
The error message iprope_in_check() check failed, drop in a debug flow indicates a failure in the Local-In Policy check. This function determines whether traffic destined to the FortiGate itself (management traffic or local services) is allowed.
C . The packet was dropped because the trusted host list is misconfigured:
Reason: If an administrator has configured Trusted Hosts (limiting administrative access to specific source IPs), and a packet arrives from an unauthorized IP, the iprope_in_check function will reject it immediately to protect the device.
D . The packet was dropped because the requested service is not enabled on FortiGate:
Reason: The most common cause for this error is that the destination interface does not have the specific service (e.g., SSH, HTTPS, PING) enabled in its set allowaccess configuration. If the service is not listening/allowed on that port, the input check fails and drops the packet.
Why other options are incorrect:
A: If traffic is dropped by a standard firewall policy (traffic passing through the FortiGate), the debug message is typically denied by policy x or no matching policy, not an iprope (Input Property/Policy Enforcement) failure.
B: A routing issue where the source is unreachable results in a Reverse Path Forwarding (RPF) failure, typically logged as reverse path check fail, drop.
FortiGate Security 7.6 Study Guide (Security Fabric & FortiGuard): 'In diagnose debug rating, the 'I' flag stands for Initial, which is the IP address resolved by DNS. The 'D' flag stands for Discovered.'
Questio ns no: 94
Verified Answer: C, D
FortiGate Troubleshooting Guide (Debug Flow): 'The message iprope_in_check() check failed indicates the packet was denied by the Local-In policy, often due to missing allowaccess settings or Trusted Host restrictions.'
Exhibit.

Refer to the exhibit, which shows the output of get system ha status.
NGFW-1 and NGFW-2 have been up for a week.
Which two statements about the output are true? (Choose two.)
FortiGate HA Troubleshooting and Synchronization Guides
Fortinet Admin Guide: HA Primary Role Retention, Cluster Break-up Due to Out-of-Sync Status
Security & Privacy
Satisfied Customers
Committed Service
Money Back Guranteed