- 85 Actual Exam Questions
- Compatible with all Devices
- Printable Format
- No Download Limits
- 90 Days Free Updates
Get All CompTIA DataAI Certification Exam Questions with Validated Answers
| Vendor: | CompTIA |
|---|---|
| Exam Code: | DY0-001 |
| Exam Name: | CompTIA DataAI Certification Exam |
| Exam Questions: | 85 |
| Last Updated: | June 27, 2026 |
| Related Certifications: | CompTIA DataAI |
| Exam Tags: | Expert Data ScientistsMachine Learning Engineers |
Looking for a hassle-free way to pass the CompTIA DataAI Certification Exam? DumpsProvider provides the most reliable Dumps Questions and Answers, designed by CompTIA certified experts to help you succeed in record time. Available in both PDF and Online Practice Test formats, our study materials cover every major exam topic, making it possible for you to pass potentially within just one day!
DumpsProvider is a leading provider of high-quality exam dumps, trusted by professionals worldwide. Our CompTIA DY0-001 exam questions give you the knowledge and confidence needed to succeed on the first attempt.
Train with our CompTIA DY0-001 exam practice tests, which simulate the actual exam environment. This real-test experience helps you get familiar with the format and timing of the exam, ensuring you're 100% prepared for exam day.
Your success is our commitment! That's why DumpsProvider offers a 100% money-back guarantee. If you don’t pass the CompTIA DY0-001 exam, we’ll refund your payment within 24 hours no questions asked.
Don’t waste time with unreliable exam prep resources. Get started with DumpsProvider’s CompTIA DY0-001 exam dumps today and achieve your certification effortlessly!
During EDA, a data scientist wants to look for patterns, such as linearity, in the dat
a. Which of the following plots should the data scientist use?
Scatter plots display pairs of numeric values on two axes, letting you visually assess relationships and patterns, such as linear trends, between variables.
Which of the following describes the appropriate use case for PCA?
Principal Component Analysis transforms correlated features into a smaller set of uncorrelated components that capture most of the variance, making it ideal for reducing dimensionality before modeling or visualization.
The following graphic shows the results of an unsupervised, machine-learning clustering model:

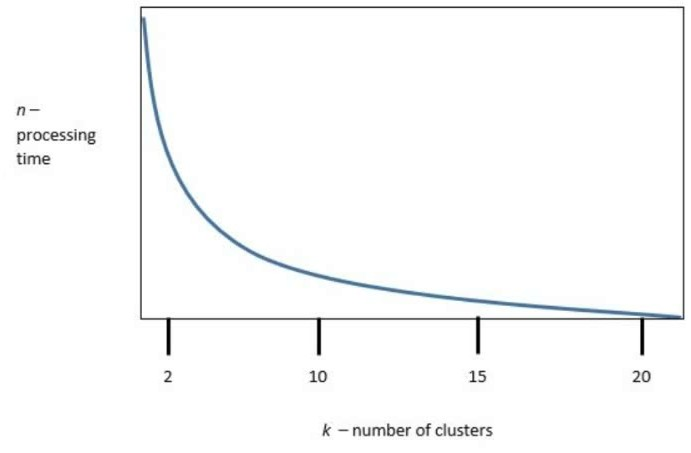
k is the number of clusters, and n is the processing time required to run the model. Which of the following is the best value of k to optimize both accuracy and processing requirements?
The curve shows a steep drop in processing time up to about k = 10, after which gains in speed taper off. Choosing 10 clusters balances sufficient model complexity with reasonable computational cost.
A data scientist has built an image recognition model that distinguishes cars from trucks. The data scientist now wants to measure the rate at which the model correctly identifies a car as a car versus when it misidentifies a truck as a car. Which of the following would best convey this information?
A confusion matrix directly shows true positives (cars correctly identified) and false positives (trucks misidentified as cars), giving you exactly the rates you're interested in.
A data scientist is analyzing a data set with categorical features and would like to make those features more useful when building a model. Which of the following data transformation techniques should the data scientist use? (Choose two.)
One-hot encoding creates binary indicator columns for each category, allowing models to treat nominal categories without implying any order.
Label encoding maps categories to integer labels, which can be useful for tree-based models or when you need a single numeric column (though you must ensure the algorithm can handle treated ordinality appropriately).
Security & Privacy
Satisfied Customers
Committed Service
Money Back Guranteed