- 64 Actual Exam Questions
- Compatible with all Devices
- Printable Format
- No Download Limits
- 90 Days Free Updates
Get All Cisco AppDynamics Associate Performance Analyst Exam Questions with Validated Answers
| Vendor: | Cisco |
|---|---|
| Exam Code: | 500-420 |
| Exam Name: | Cisco AppDynamics Associate Performance Analyst |
| Exam Questions: | 64 |
| Last Updated: | January 24, 2026 |
| Related Certifications: | Channel Partner Program, Cisco AppDynamics Certifications |
| Exam Tags: | Specialization Cisco AdministratorCisco ArchitectCisco Consultant |
Looking for a hassle-free way to pass the Cisco AppDynamics Associate Performance Analyst exam? DumpsProvider provides the most reliable Dumps Questions and Answers, designed by Cisco certified experts to help you succeed in record time. Available in both PDF and Online Practice Test formats, our study materials cover every major exam topic, making it possible for you to pass potentially within just one day!
DumpsProvider is a leading provider of high-quality exam dumps, trusted by professionals worldwide. Our Cisco 500-420 exam questions give you the knowledge and confidence needed to succeed on the first attempt.
Train with our Cisco 500-420 exam practice tests, which simulate the actual exam environment. This real-test experience helps you get familiar with the format and timing of the exam, ensuring you're 100% prepared for exam day.
Your success is our commitment! That's why DumpsProvider offers a 100% money-back guarantee. If you don’t pass the Cisco 500-420 exam, we’ll refund your payment within 24 hours no questions asked.
Don’t waste time with unreliable exam prep resources. Get started with DumpsProvider’s Cisco 500-420 exam dumps today and achieve your certification effortlessly!
A Performance Analyst needs to send a summary report of specific events every two hours. Which feature can enable this automated report summary?
To send a summary report of specific events every two hours, a Performance Analyst can use the 'Email Digests' feature in AppDynamics. This feature allows for the automated aggregation and delivery of pertinent event information at predefined intervals, ensuring stakeholders remain informed about the application's performance and significant events without the need for constant manual monitoring.
AppDynamics documentation on Alerting and Notifications: Details the configuration of email notifications and digests for events and alerts, including scheduling and content customization options.
AppDynamics documentation on Reports: Provides information on various reporting features, including the setup of automated email digests.
Which two methods are used to plot Host CPU and GC Time Spent in a single view? (Choose two.)
To plot Host CPU and GC (Garbage Collection) Time Spent in a single view, the 'JMX tab under 'Tiers and Nodes'' and the 'Metrics Browser' are the appropriate methods. The JMX tab provides access to Java Management Extensions (JMX) metrics, including those related to GC time. The Metrics Browser allows for the customization and aggregation of various metrics, including Host CPU usage and GC metrics, enabling a combined view of these critical performance indicators.
AppDynamics documentation on Monitoring Tiers and Nodes: Discusses the JMX metrics available for Java applications, including garbage collection details.
AppDynamics documentation on the Metrics Browser: Describes how to use the Metrics Browser to view and analyze a wide range of performance metrics.
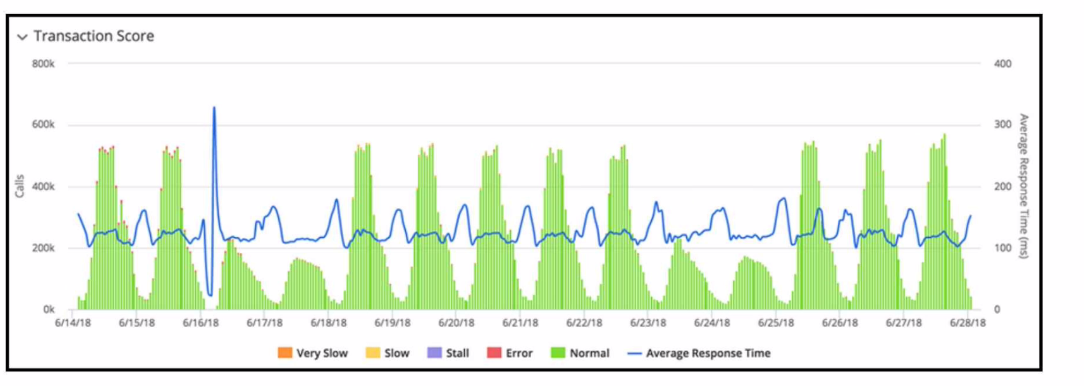
Refer to Exhibit.

R
Refer to the exhibit. The transaction score in the graphic displays an interesting performance pattern outside of business hours on 6/16/18. Which additional performance anomaly should be of most interest to a Performance Analyst?
The performance pattern outside of business hours on 6/16/18 that would be of most interest to a Performance Analyst is the elevated response time, as indicated on 6/19/18. This is because it shows a significant spike in response time, which could indicate a performance issue that needs to be addressed. Anomalies in response time can often be more indicative of underlying problems than changes in call volume, especially when they occur outside of expected peak periods.
AppDynamics documentation on Transaction Score: https://docs.appdynamics.com/latest/en/application-monitoring/application-dashboard/transaction-score
Which tab within the Application Dashboard displays performance trends for each of Snapshots, Average Response Time, and Events within one central view?
The Transaction Score tab within the Application Dashboard is designed to display performance trends across various metrics including Snapshots, Average Response Time, and Events. It gives a comprehensive view of the transaction performance, providing a score that reflects the health and reliability of transactions over time.
AppDynamics documentation on Application Dashboard:
Refer to exhibit.

Refer to the exhibit. Using this heap utilization graph, which method is used to confirm if a memory leak is occurring during a certain time frame?
To confirm if a memory leak is occurring, one should refer to the Tiers and Nodes section of the AppDynamics Controller UI, navigate to the Memory tab, and observe the Heap Utilization over time in relation to the Heap's Current Usage (MB) versus the Maximum (MB) allocated. Consistent growth in heap utilization or an upward trend that does not decrement even after garbage collection indicates a potential memory leak.
Security & Privacy
Satisfied Customers
Committed Service
Money Back Guranteed